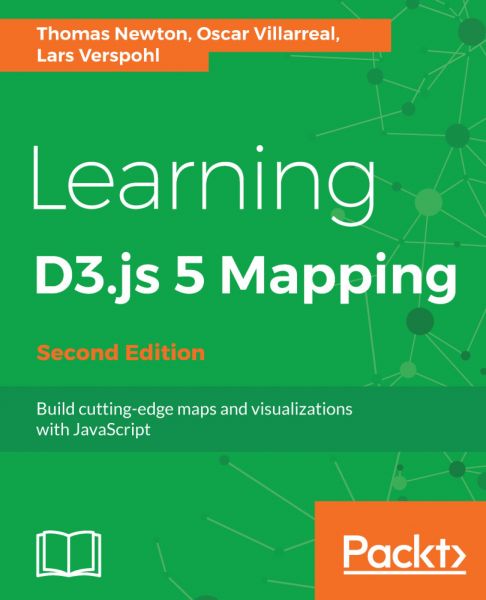
Learning D3.js 5 Mapping
Build cutting-edge maps and visualizations with JavaScript
D3.js is a visualization library used for the creation and control of dynamic and interactive graphical forms. It is a library used to manipulate HTML and SVG documents as well as the Canvas element based on data. Using D3.js, developers can create interactive maps for the web, that look and feel beautiful.
This book will show you how build and design maps with D3.js and gives you great insight into projections, colors, and the most appropriate types of map.
The book begins by helping you set up all the tools necessary to build visualizations and maps. Then it covers obtaining geographic data, modifying it to your specific needs, visualizing it with augmented data using D3.js. It will further show you how to draw and map with the Canvas API and how to publish your visualization. By the end of this book, you'll be creating maps like the election maps and the kind of infographics you'll find on sites like the New York Times.
Versandkostenfreie Lieferung! (eBook-Download)
Als Sofort-Download verfügbar
- Artikel-Nr.: SW9781787284258450914
- Artikelnummer SW9781787284258450914
-
Autor
Thomas Newton, Lars Verspohl, Oscar Villarreal
- Verlag Packt Publishing
- Seitenzahl 495
- Veröffentlichung 30.11.2017
- Barrierefreiheit
- Keine Angabe: Keine Informationen zur Barrierefreiheit bereitgestellt
- ISBN 9781787284258
- Verlag Packt Publishing

